Use the blood type chart
Choose your ABO group and positive or negative RhD sign. The result shows the published percentage, an approximate 1 in N frequency and its position among the eight main types. Change the reference to update the result, comparison and chart together.
The 100-square graphic represents percentage points: 6.6% fills six squares and part of a seventh. It is a visual scale, not a sample of 100 actual people. Compare two blood types uses the same selected reference for both choices. Equal published percentages remain a tie.
Blood type method
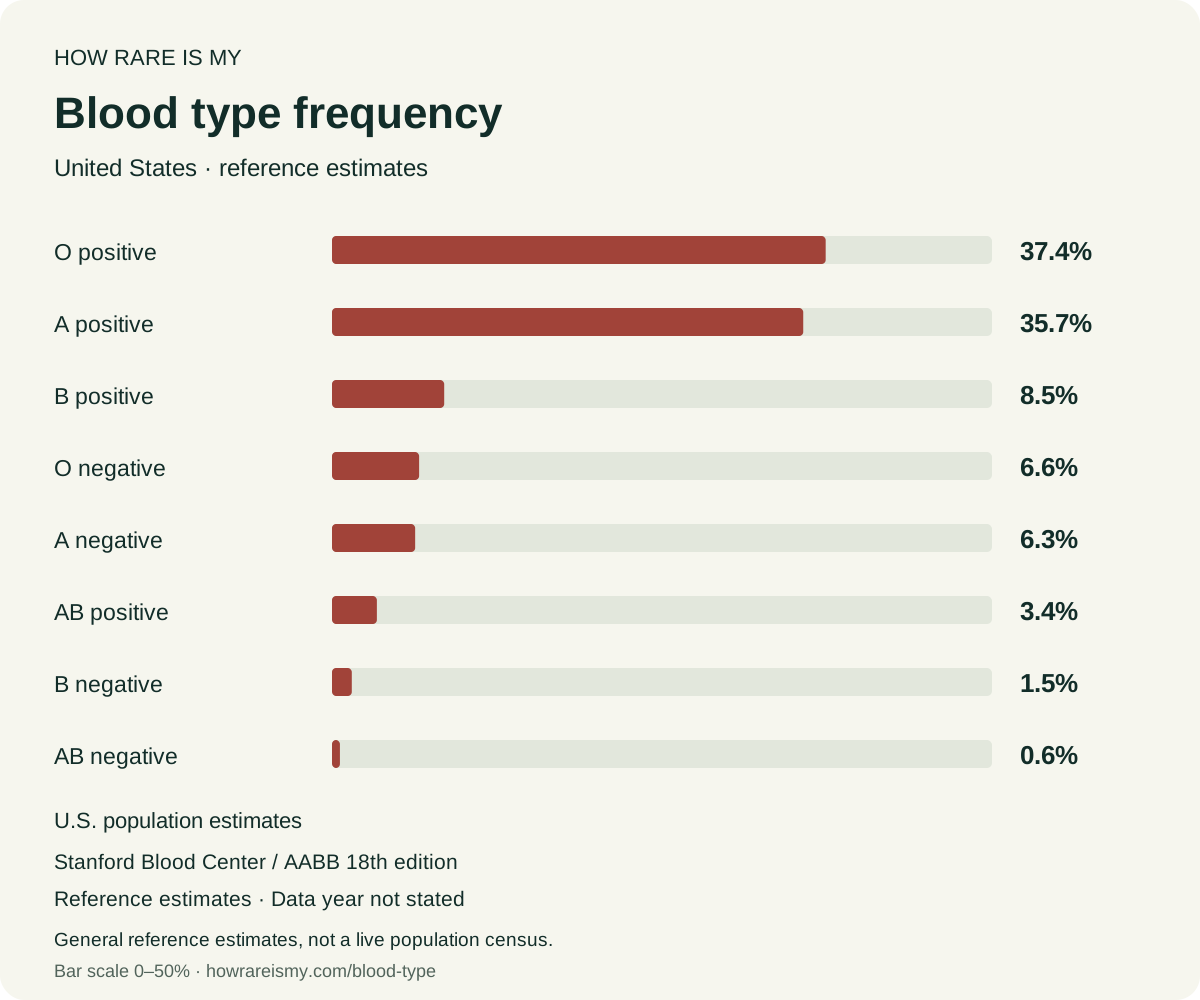
The U.S. reference comes from Stanford Blood Center, which attributes its estimates to the AABB Technical Manual, 18th edition. Its page does not state the underlying data year or sample size. The card preserves that limitation instead of presenting a 2026 population count.
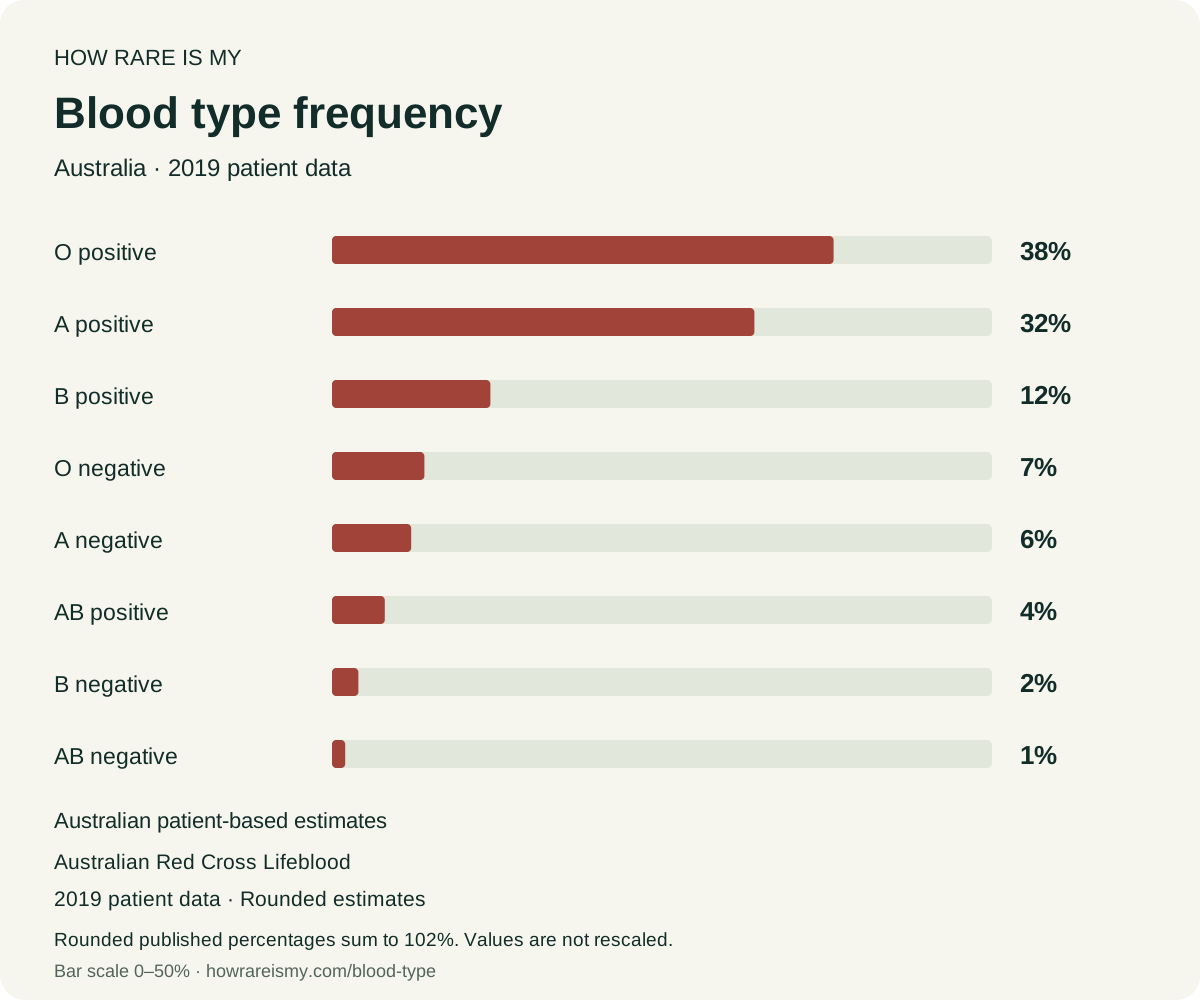
The Australian reference uses the rounded Lifeblood percentages based on 2019 patient pathology results. Their eight published values total 102%. We keep those numbers as published; rescaling them to 100% would change the source.
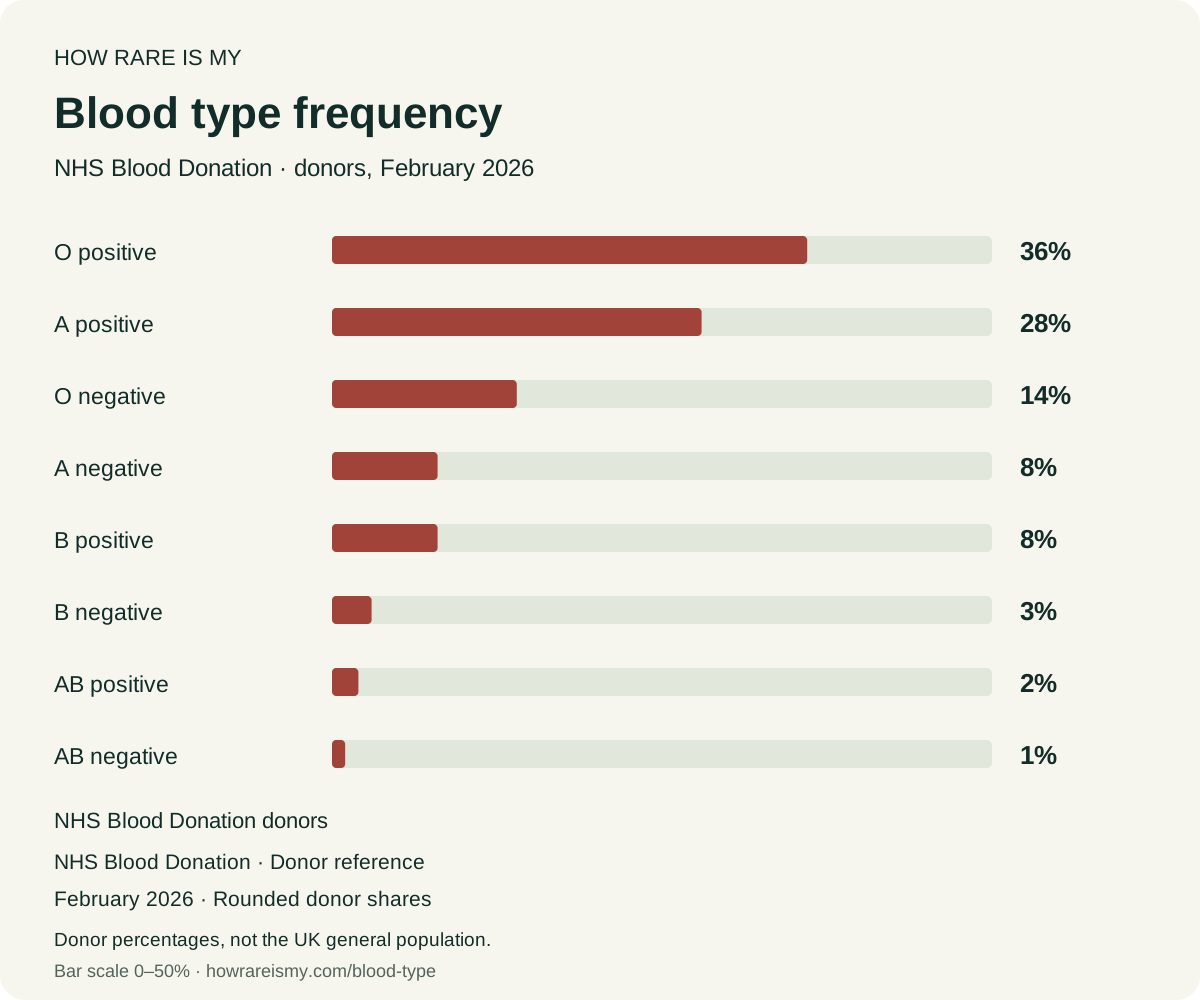
The NHS Blood Donation table describes its donors in February 2026. Donors are a selected group, so these percentages cannot stand in for the UK population. We consistently use that dated eight-type list.
For a percentage p, the approximate frequency is 1 in (100 ÷ p). We round the denominator to a whole number and retain the percentage beside it. A rank counts how many listed types have a greater percentage, plus one; ties share a rank. None of these calculations estimates your clinical need or a worldwide rarity score.
Blood type rarity and compatibility
An ABO letter and RhD sign describe two blood-group systems. Other red-cell antigens matter in transfusion medicine, so the least common of these eight types is not a claim to the rarest blood in the world. The American Red Cross explains blood typing and cross-matching.
Our blood type compatibility chart answers a separate question: which main ABO/RhD groups can provide red cells to which recipients. It includes a complete printable matrix. It is an educational reference, not an individual transfusion recommendation.
Keep the chart or make a card
Download the original frequency chart as SVG or the source-labelled table as CSV. The tables and downloads are available without running the tool. Preview & style your card creates a story or landscape PNG with your chosen type and reference; no personal result is put into a link or sent to a lookup service.
For another comparison, explore the eye-color survey chart, your adult height percentile, or your birthday's frequency. Each uses a separate source. These facts are not multiplied into a probability of being you. The methodology keeps the source details together.
Good questions
What is the rarest blood type?
Among the eight main ABO/RhD groups, AB negative has the smallest share in each reference here: 0.6% in the U.S. estimates, 1% in the rounded Australian estimates and 1% among NHS Blood Donation donors. Clinical rare blood types involve more antigens than this eight-group chart measures.
How rare is O negative blood?
The references give O negative as 6.6% in the U.S. estimates, 7% in the rounded Australian patient-based estimates and 14% among NHS Blood Donation donors. These describe different groups. The donor figure is not a UK population estimate.
Why do blood type percentages differ between countries and sources?
A donor service, patient sample and general reference estimate need not have the same distribution. The dates, methods and rounding can also differ. Choose one reference for a comparison; this tool does not average the datasets together.
Does a rare blood type tell me whom I can donate to?
Frequency and compatibility are different questions. Use the red-cell compatibility chart for a basic ABO/RhD reference. Actual transfusions require blood typing, antibody testing and clinical matching, and plasma uses different rules.