What the birthday heatmap shows
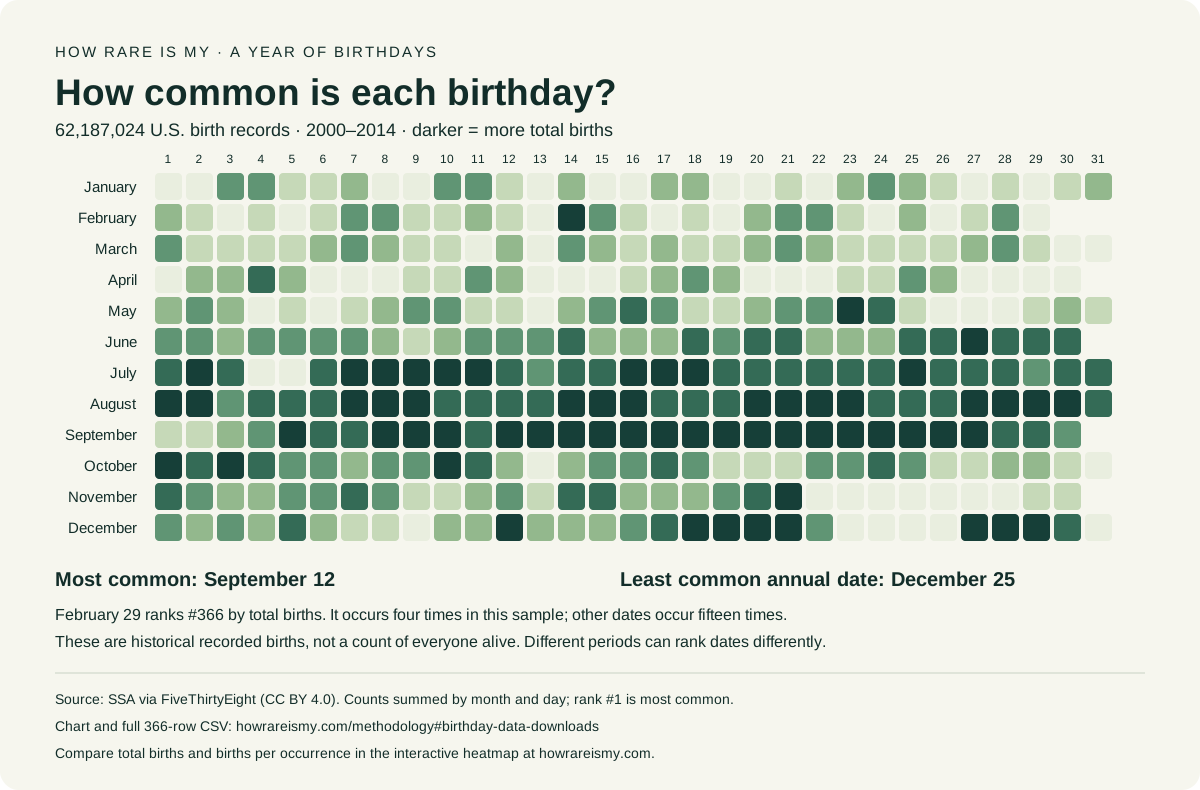
The chart compares 62,187,024 U.S. birth records from 2000–2014, compiled from SSA data by FiveThirtyEight. Each square is a calendar date. The six colors divide dates into equally sized rank bands; darker means more common. Select a square to see the recorded count and rank, or use the month and day controls below it.
September 12 ranks first in this file. December 25 has the fewest births among dates that occur every year. February 29 has the lowest total because it occurs only four times in the fifteen-year sample. Other periods and datasets can give different rankings.
Switch from Total births to Per occurrence to divide leap-day births by four and other dates by fifteen. The colors, readout and rank chart then use that daily average. The rarity card keeps total-birth frequency, with its source attached. These are historical records, not a count of everyone alive with a particular birthday.
Compare dates and months
Month labels open complete rankings: January, February, March, April, May, June, July, August, September, October, November and December. Each row includes the national rank, frequency and average births per occurrence.
You can go straight to February 29, September 12 or December 25, or compare the 30 rarest and 30 most common birthdays. The monthly bars below the calculator divide births by observed days, so longer months do not get higher bars simply for having more days.
Choose Compare two birthdays below a result for a side-by-side comparison in the same sample. Read the birthday calculations for denominator and leap-day details.
Download the chart or make a card
Save infographic includes your selected date, heatmap measure and charts. For a worksheet or your own analysis, download the public SVG and 366-row CSV. They include the source, period and calculation context.
Select Make a card to open your date's result, then Preview & style your card for Sage, Lilac or Midnight, in story or landscape sizes. Add another fact keeps your birthday while adding a first-name or surname result. The card maker keeps these populations separate; it never multiplies them into personal-uniqueness odds. Images are created on your device without an account.
Explore other references
Compare language spoken at home, adult height, blood type, eye color or household income by age. Each uses a labelled population and period. The car lookup offers UK registrations and Washington plug-in vehicles; the dog-name generator uses NYC license-period records. These references do not estimate worldwide rarity.
Keep the chart. Check the numbers.
A printable view of all 366 birthdays, plus the full table for your own spreadsheet. Both use the same 2000–2014 U.S. birth records as this calculator.
Download printable SVG Download all 366 dates (CSV)
Data: SSA via FiveThirtyEight, CC BY 4.0. We aggregate daily records by month and day. The CSV keeps counts, occurrences, ranks and the denominator so the result can be checked. Cite our sources and calculation when referring to these rankings.
Good questions
What is the rarest birthday?
February 29 has the fewest births across this 2000–2014 U.S. dataset because it occurs only four times. Among dates that occur every year, December 25 has the fewest recorded births.
What is the most common birthday?
September 12 ranks first in this SSA 2000–2014 sample. Other sources and periods can give a different answer, so a ranking needs a source and date range.
Can I use the card as a birthday filter?
You can save a portrait PNG and add it to a story, video or message. This site makes image cards; it is not an official TikTok or Instagram camera filter.