How the calculator counts
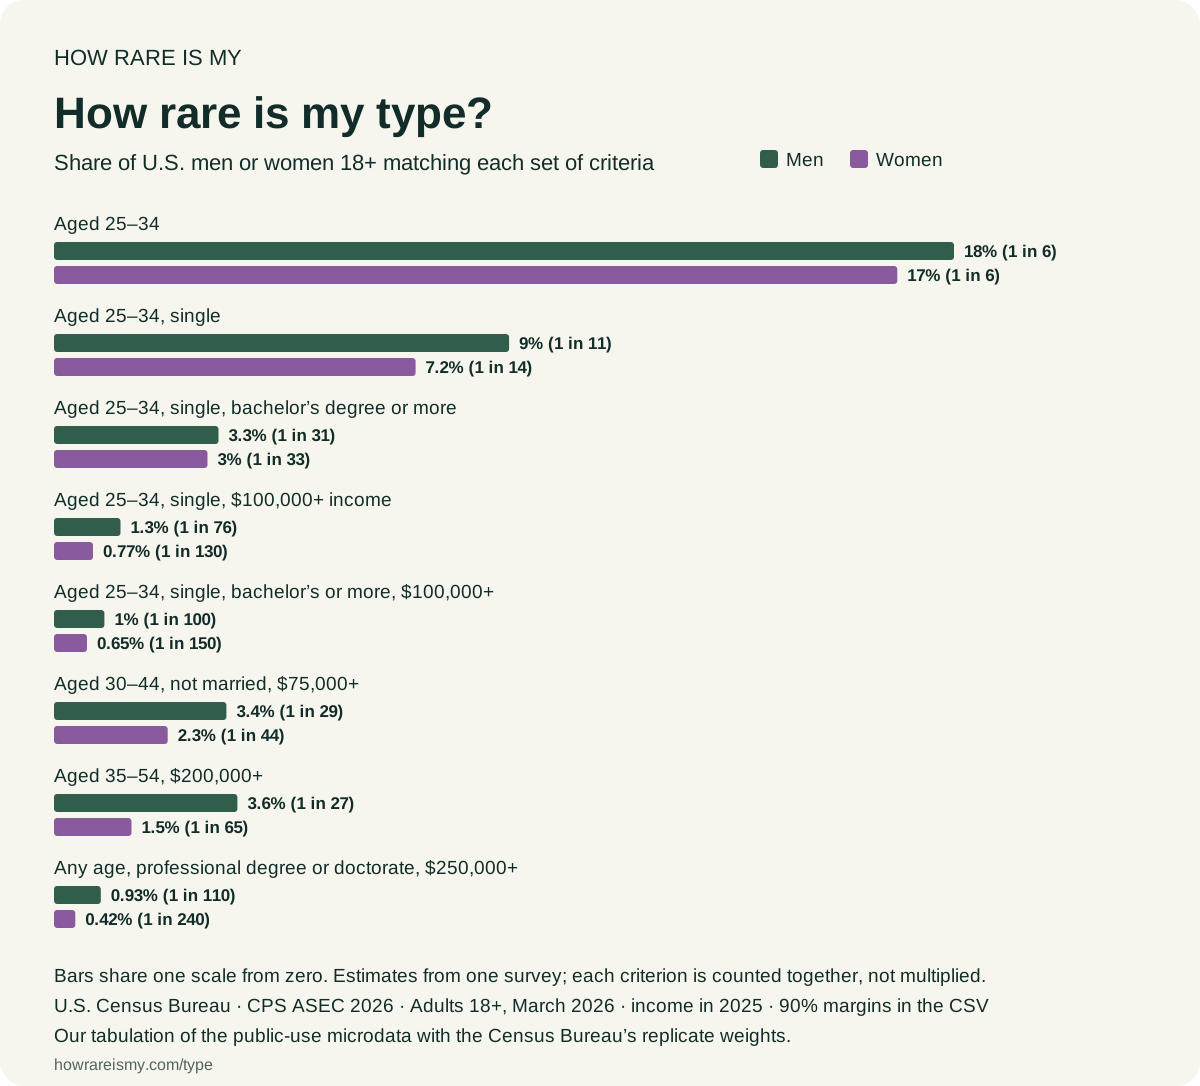
Choose who you are looking for, an age range and any of three other criteria. The result is the share of all U.S. men, women or adults aged 18 and over who meet every criterion, with the estimated number of people and a 90% margin of error. The steps under the result show how each criterion narrows the group: first the age range, then relationship status, education and income, each as a share of the whole group and of the step before.
The verdicts describe that share: a common type at 10% or more, uncommon from 1% to 10%, rare from 0.1% to 1% and very rare below 0.1%. They describe how many people fit the criteria, not whether the criteria are reasonable.
Why one survey matters
Viral “how rare is your type” calculators usually multiply separate percentages: the share of men in an age range, times the share who are single, times the share with a degree, times the share above an income. That only works if the traits are unrelated, and they are not.
Take men with a professional degree or doctorate and a personal income of $250,000 or more. Multiplying the two separate shares, about 4.0% and 4.5% of U.S. men, suggests 0.18%. Counting the men who have both gives 0.93%, five times as many, because high incomes are far more common among doctors, lawyers and PhDs. The errors can run the other way. Women aged 30 to 44 are less often unmarried than women overall (40% against 50%), and unmarried women in that age group are less likely to have a $200,000 income (2.5% against 4.1%). Multiplying suggests 0.37% of U.S. women for that combination; the survey counts 0.25%.
This calculator counts people, so the overlaps are already in the number.
Where the numbers come from
The data is the U.S. Census Bureau’s 2026 Current Population Survey Annual Social and Economic Supplement public-use file, the survey behind the official income and poverty reports. It covers adults interviewed in March 2026 about their income in 2025. We tabulated every combination the calculator offers from the file, with the survey’s person weights, and computed each margin of error from its 160 replicate weights, as the Census Bureau recommends. Our counts match the Bureau’s published PINC-01 income tables by sex and age to within a quarter of a percent.
These are survey estimates, not a census of individuals, and they describe people who live in households. Read the full method for this tool, compare household income by age, or check where you stand on adult height.
Good questions
How is this different from a “delusion calculator”?
Those viral calculators multiply a separate percentage for each criterion, which assumes the traits are unrelated. They are not: income depends on education and age, and marriage differs by both. This tool counts the people who meet every criterion at once in the same survey, gives a margin of error, and makes no judgment about anyone’s standards.
Why can’t I filter by height?
The Current Population Survey does not measure height. Multiplying a height percentage from another survey would mix two samples and assume height is unrelated to income and everything else. The adult height calculator shows CDC height percentiles on their own.
What does “single” mean here?
Not married and not living with a partner in the same household. The survey cannot see who is dating, engaged, or in a relationship with someone who lives elsewhere.
Which income counts?
Each person’s own total money income in 2025, before taxes: earnings plus investment, retirement, Social Security and other regular income. It is not household income and not wealth.
Why do some combinations say too few respondents?
The survey interviewed about 103,000 adults. When fewer than 30 of them match every criterion, the estimate would be too unreliable, so the tool shows no number rather than a guess or a zero.
Who is counted?
Adults 18 and over living in U.S. households in March 2026, including Armed Forces members who live off post or with family. People in prisons, nursing homes and military barracks are outside the survey.
Why only men and women?
The survey records sex as male or female. Choose Anyone to count both together.