English and Spanish in the national picture
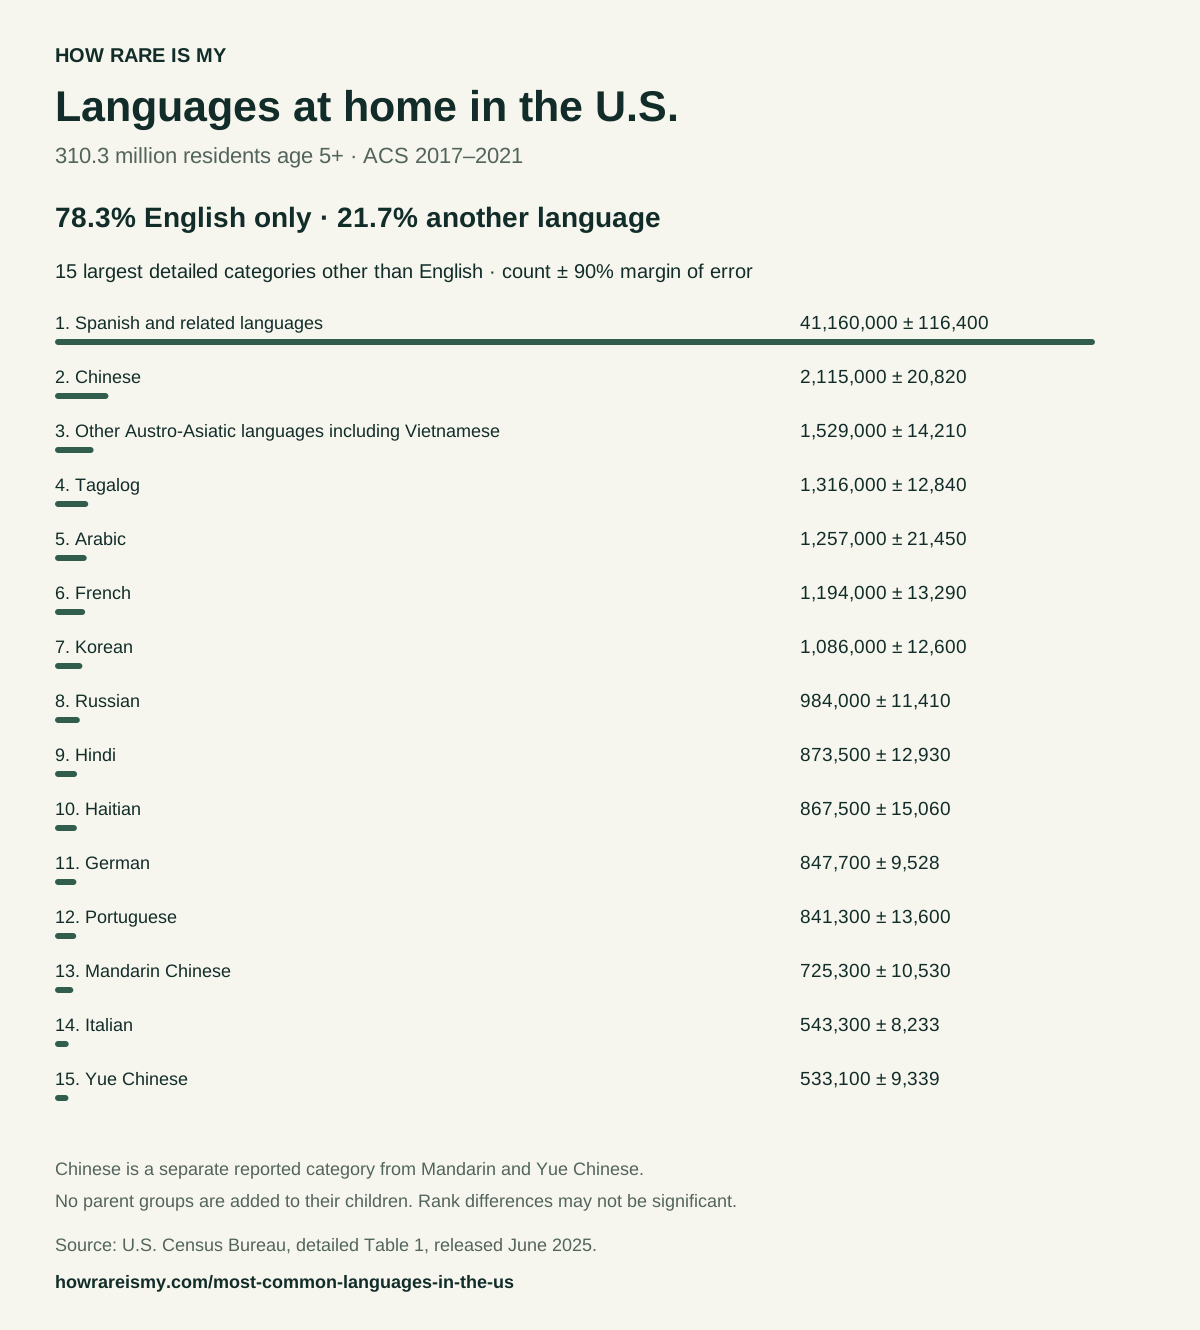
The Census Bureau's detailed language release estimates 243,100,000 U.S. residents age 5 and over spoke only English at home during 2017–2021. That is approximately 78.3% of its 310,300,000-person comparison population. Another 67,200,000, approximately 21.7%, reported a language other than English at home.
Within the non-English data, Spanish and related languages has the largest estimate: 41,160,000 people, about 13.3% of the full age-5-and-over population. The source publishes this as a combined category. We keep that label rather than implying the table distinguishes every variety within it.
These figures answer a home-language question. People reporting another language may also speak English, and people reporting English may know additional languages. The English-only count therefore cannot establish how many Americans are fluent in English, nor can the non-English count establish how many are bilingual. The Census source page explains the release and links its original tables.
Why language rankings can look different
A ranking depends on how categories are combined. This chart uses the most detailed available rows in the Census workbook. It excludes a broader group whenever that group has separately listed children. That keeps a parent total and its component categories out of the same ranking.
For example, the detailed Chinese category estimates 2,115,000 people. Mandarin Chinese estimates 725,300, and Yue Chinese estimates 533,100. Those are separate reported categories inside the broader Chinese group, which estimates 3,460,000 across all its included rows. A list using that broader total will look different from the detailed chart above. Neither the generic Chinese row nor the Mandarin row can identify everybody capable of speaking Mandarin.
The same issue appears with French and Tagalog. A broader French group includes the detailed French row plus other French varieties. The broader Tagalog group includes separate Filipino and Tagalog rows. A reader comparing two websites should check the category labels, population and survey period before concluding that their numbers disagree.
Some terminal categories still contain several languages: the source does not publish a more detailed breakdown for every group. The chart preserves those combined labels. It is a ranking of published categories, not a claim that every row describes one individual language.
How to read the chart and its margins of error
The displayed percentage is the count divided by 310,300,000, multiplied by 100. All fifteen rows use that same national denominator. The bars compare each estimate with the largest displayed category, while the percentage column describes its share of the full population. English-only use appears separately above the chart.
The ± column preserves each count's 90% margin of error. Ordering the point estimates does not prove that every neighboring pair differs statistically. Small gaps should be read with their uncertainty, rather than treated as a precise contest for a rank. Published values are independently rounded, and component rows need not sum exactly to a group's rounded total.
The chart is derived from a five-year ACS estimate for 2017–2021, released in June 2025. The release date is not the measurement year. We use this source for its unusually detailed categories; the result does not claim to be a live 2026 ranking. A language missing from the release remains unknown, not a zero-speaker language.
Compare states, look up a language, or download the data
National figures can conceal strong differences between states. The language-by-state explorer shows the fifteen published non-English categories for each state and D.C., together with each state's own population denominator. The French profile gives concrete examples from Maine, Vermont and Louisiana, alongside the distinction between detailed French and the broader group.
For a language outside this chart, use the language rarity lookup. It searches all 566 published entries, including broader groups, and can make a source-labeled share card. The downloadable ranked CSV on this page instead includes only the most detailed available non-English categories. Its source row identifiers make it possible to check each figure against the original workbook.
The SVG chart keeps the leading fifteen categories and their uncertainty together for reference. Read the language methodology before combining categories or reusing percentages with a different population.
Good questions
What is the most common language in the United States?
English-only home use accounts for 243,100,000 residents age 5 and over, about 78.3%, in this 2017–2021 ACS release. People reporting another home language may also speak English, so this is not a count of everyone who knows English.
What is the most common language other than English?
Spanish and related languages has the largest published non-English estimate in this release: 41,160,000 U.S. residents age 5 and over, with a 90% margin of error of ±116,400. That is about 13.3% of the comparison population.
Why are Chinese, Mandarin and Yue listed separately?
This chart uses the most detailed available source categories. Chinese is a reported category within a broader Chinese group, alongside named varieties such as Mandarin and Yue. The broader group estimate is 3,460,000, but adding that subtotal to its detailed rows would double-count people.
Are these the most spoken languages in 2026?
These are historical home-language estimates for 2017–2021, released in June 2025. They do not establish today's speaker counts, worldwide popularity or everyone's ability to speak a language.