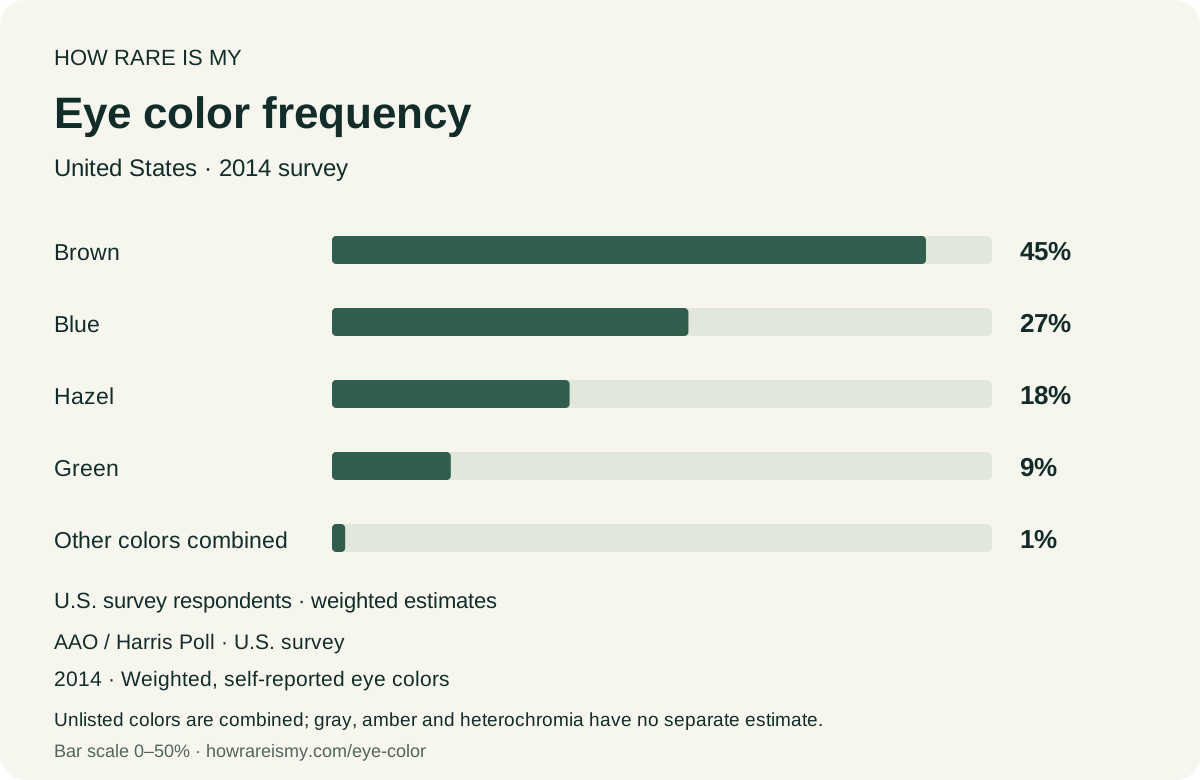
Read the eye-color chart
The chart uses five published categories: brown, blue, hazel, green and other colors combined. Choose a color to see its survey percentage and approximate frequency. Compare two choices using the same reference, or save a card that keeps the survey date and population visible.
The iris illustrations are original color cues. They are not a clinical color scale, a photograph classifier or a way to infer ancestry. Gray and grey mean the same selection here. If your eyes do not fit one of the four named survey colors, the honest result is that a separate frequency is unavailable.
Eye color method
The American Academy of Ophthalmology reports a 2014 Harris Poll of more than 2,000 Americans, weighted to reflect the U.S. population at that time. Participants reported their eye colors. Its published shares are 45% brown, 27% blue, 18% hazel, 9% green and 1% other colors combined.
This is a historical survey, not a world census or a current count of people with your eyes. Its article does not provide separate uncertainty intervals for these percentages. We retain the published whole percentages and do not invent narrower confidence bounds.
For a percentage p, we calculate 100 ÷ p for the approximate 1-in-N frequency. The denominator is rounded to a whole number. The chart keeps the percentage visible so that rounding is clear. Named-color ranks exclude the combined other-colors group. Missing colors get neither a zero nor the entire 1% remainder. Download the survey CSV or read the source methodology.
Eye color and genetics
Eye color varies along a continuum rather than falling into perfectly separated boxes. MedlinePlus Genetics explains that multiple genes affect iris pigmentation. OCA2 and HERC2 have major roles, while other genes also contribute. Melanin and the way light interacts with the iris influence its appearance.
That is why a basic Punnett square with one brown allele and one blue allele is too simple to predict every child's eyes. A pair of parental color labels cannot supply reliable personal probabilities. This tool therefore offers a sourced frequency chart and explanation, rather than presenting a baby-eye prediction as a measured fact.
Heterochromia describes differences in coloration between eyes or within an iris. It is not another mutually exclusive color in this survey: an individual can have both a named base color and a pattern of mixed coloration. We do not add it to the five survey rows or assign it the leftover percentage.
Compare another part of your story
The blood-type chart compares the eight main ABO/RhD groups with separately labelled references. The height calculator compares measurements with U.S. adult percentiles. Your birthday heatmap answers a calendar question from historical birth records. Each can make its own share card, with its own source; combining the percentages would not produce valid personal odds.
Good questions
What is the rarest eye color in this chart?
Green is the least common of the four named colors in this U.S. survey, at 9%. The remaining 1% combines all other reported colors. It cannot establish the frequency of gray or amber separately, or the rarest eye color worldwide.
How rare are hazel eyes?
Hazel accounts for 18% in the weighted 2014 U.S. Harris Poll published by the American Academy of Ophthalmology. That is approximately 1 in 6 in this reference. It is not an estimate for the whole world.
How rare are gray or amber eyes?
This survey does not publish a separate figure for gray or amber eyes. Both selections return not separately measured. The 1% other-colors group cannot be assigned to either color individually.
Can parents' eye colors predict their baby's eye color?
Several genes influence eye color. A simple brown-dominant, blue-recessive chart does not capture that inheritance. This tool compares reported colors in a survey; it does not calculate a baby's eye-color probabilities.
Does heterochromia have a percentage here?
No. Different-colored eyes or different colors within an iris are not separately counted in this published table. Selecting heterochromia shows that missing-data limit rather than assigning an unsupported rarity.