How Rare Is My.

A little curiosity. A real number.

What languages are spoken in your state?

Choose a state to explore home-language estimates, compare the numbers, and save a chart.

Download all state data (CSV)

Language at home · ACS 2017–2021

California

37,110,000 residents age 5+ · population estimate ± 669

43.8%used a language other than English at home

20,830,000English only at home 90% margin of error: ± 49,120

16,270,000Another language at home 90% margin of error: ± 49,090

15 most common reported categories

Other than English · bars compare counts with the largest category in this state.

  1. Spanish10,510,000 ± 34,690

    28.3% of the state’s age-5+ population

  2. Tagalog646,800 ± 9,416

    1.74% of the state’s age-5+ population

  3. Chinese641,600 ± 11,220

    1.73% of the state’s age-5+ population

  4. Vietnamese and other Austro-Asiatic languages556,400 ± 8,380

    1.5% of the state’s age-5+ population

  5. Korean358,000 ± 7,365

    0.965% of the state’s age-5+ population

  6. Mandarin Chinese311,600 ± 7,353

    0.84% of the state’s age-5+ population

  7. Yue Chinese270,700 ± 6,142

    0.729% of the state’s age-5+ population

  8. Hindi202,000 ± 6,439

    0.544% of the state’s age-5+ population

  9. Iranian Persian195,700 ± 6,197

    0.527% of the state’s age-5+ population

  10. Armenian195,400 ± 5,581

    0.527% of the state’s age-5+ population

  11. Arabic191,400 ± 7,858

    0.516% of the state’s age-5+ population

  12. Russian170,500 ± 4,817

    0.459% of the state’s age-5+ population

  13. Punjabi142,000 ± 6,006

    0.383% of the state’s age-5+ population

  14. Japanese136,000 ± 4,892

    0.366% of the state’s age-5+ population

  15. Filipino133,200 ± 4,216

    0.359% of the state’s age-5+ population

± is the 90% margin of error for each count. Ordering uses point estimates; nearby ranks may not be statistically different. Only the 15 published categories are shown. Missing languages have no estimate here.

Source: U.S. Census Bureau, Table 2, released June 2025. Chinese and named varieties are separate reported categories; this is not a list of everyone able to speak each language.

50 states + D.C.

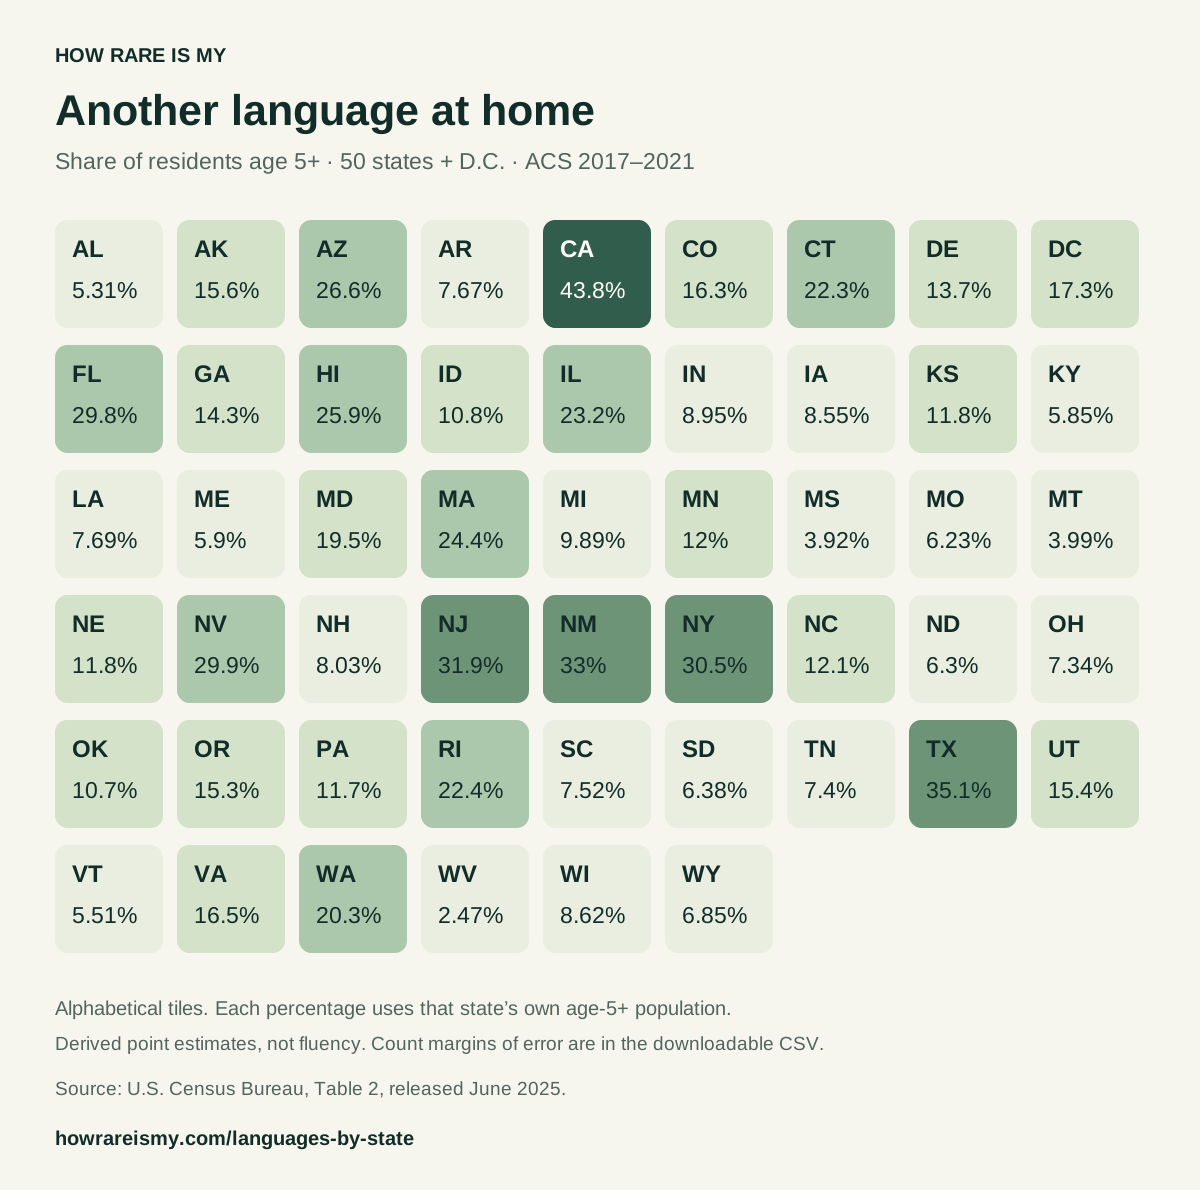
Another language at home, state by state

Share of residents age 5+. Select a tile to explore that state.

Save the overview
Under 10%10–19.9%20–29.9%30–39.9%40%+

Tiles are alphabetical, not a geographic map. Each state uses its own age-5+ population. Percentages are derived point estimates; count margins of error are in the table.

Read the complete state comparison table
ACS 2017–2021 · U.S. residents age 5+ · 90% count margins of error
StatePopulation age 5+Other-language home useShareLargest non-English category
Alabama4,702,000± 721249,600± 4,5705.31%Spanish
Alaska685,200± 205106,900± 2,19415.6%Spanish
Arizona6,667,000± 2191,773,000± 11,77026.6%Spanish
Arkansas2,822,000± 614216,400± 3,5157.67%Spanish
California37,110,000± 66916,270,000± 49,09043.8%Spanish
Colorado5,399,000± 616877,500± 9,24216.3%Spanish
Connecticut3,423,000± 306764,100± 8,14922.3%Spanish
Delaware927,700± 146127,200± 3,18713.7%Spanish
District of Columbia640,200± 71110,800± 2,75717.3%Spanish
Florida20,220,000± 6566,030,000± 23,71029.8%Spanish
Georgia9,982,000± 1,1391,425,000± 11,55014.3%Spanish
Hawaii1,366,000± 94353,700± 6,51325.9%Iloko
Idaho1,697,000± 407182,800± 4,16810.8%Spanish
Illinois12,080,000± 5802,807,000± 16,13023.2%Spanish
Indiana6,336,000± 694566,800± 6,6128.95%Spanish
Iowa2,985,000± 576255,300± 5,0608.55%Spanish
Kansas2,747,000± 471323,200± 5,19611.8%Spanish
Kentucky4,223,000± 753247,100± 5,2245.85%Spanish
Louisiana4,360,000± 619335,200± 5,6417.69%Spanish
Maine1,293,000± 27576,290± 2,4715.9%French
Maryland5,785,000± 2541,126,000± 10,10019.5%Spanish
Massachusetts6,634,000± 2611,616,000± 10,54024.4%Spanish
Michigan9,498,000± 402939,700± 9,6489.89%Spanish
Minnesota5,322,000± 427638,100± 6,75312%Spanish
Mississippi2,785,000± 810109,200± 2,9263.92%Spanish
Missouri5,774,000± 756359,700± 5,9486.23%Spanish
Montana1,018,000± 32840,660± 1,7173.99%Spanish
Nebraska1,821,000± 341215,700± 3,47111.8%Spanish
Nevada2,878,000± 344859,200± 6,96629.9%Spanish
New Hampshire1,309,000± 263105,100± 2,8038.03%Spanish
New Jersey8,704,000± 2672,780,000± 14,86031.9%Spanish
New Mexico1,989,000± 505656,000± 6,83433%Spanish
New York18,960,000± 5105,783,000± 22,73030.5%Spanish
North Carolina9,773,000± 9981,180,000± 8,16912.1%Spanish
North Dakota719,900± 28645,340± 1,7996.3%Spanish
Ohio11,080,000± 572813,400± 9,3527.34%Spanish
Oklahoma3,695,000± 401397,100± 5,03210.7%Spanish
Oregon3,984,000± 490608,600± 6,73215.3%Spanish
Pennsylvania12,270,000± 4801,432,000± 11,33011.7%Spanish
Rhode Island1,037,000± 205232,200± 4,14122.4%Spanish
South Carolina4,793,000± 558360,200± 5,8567.52%Spanish
South Dakota822,200± 41452,470± 2,1406.38%Spanish
Tennessee6,454,000± 872477,400± 6,5427.4%Spanish
Texas26,900,000± 1,1509,443,000± 31,99035.1%Spanish
Utah2,986,000± 355461,000± 6,18715.4%Spanish
Vermont612,500± 19833,740± 1,2965.51%French
Virginia8,081,000± 8761,330,000± 10,17016.5%Spanish
Washington7,168,000± 4451,454,000± 10,88020.3%Spanish
West Virginia1,708,000± 39542,180± 1,9322.47%Spanish
Wisconsin5,542,000± 429477,700± 5,1378.62%Spanish
Wyoming542,400± 42237,140± 1,8086.85%Spanish

How to explore languages by state

Choose any of the fifty states or the District of Columbia. The profile shows the estimated population age 5 and over, the number reporting only English at home, and the number reporting another home language. Beneath it are the fifteen largest non-English categories published for that state, ordered by their estimated counts.

Each percentage divides a category's count by that state's own age-5-and-over population. It is not the state's share of all U.S. speakers. For example, California's other-language home-use estimate is 16,270,000 among 37,110,000 residents age 5+, approximately 43.8%. Its percentage therefore answers a different question from a national speaker count.

The alphabetical heatmap provides a quick comparison of other-language home use. Every tile has a numerical label, and selecting it opens the corresponding state profile. The complete comparison table also presents the underlying counts and margins of error. No location permission is needed; your choice stays in the page.

What the state data measures

These figures come from Table 2 of the Census Bureau's detailed 2017–2021 language release, published in June 2025. The original workbook and documentation cover language spoken at home among U.S. residents age 5 and over. A five-year survey estimate describes that period, not today's population or five annual populations added together.

The category labels matter. The source reports “Chinese,” “Mandarin Chinese” and “Yue Chinese” separately, rather than assigning every Chinese response to a named variety. It also publishes some combined labels, such as “Vietnamese and other Austro-Asiatic languages.” We preserve those labels instead of presenting their entire counts as one narrower language.

The national language rarity tool includes more detailed categories and broader parent groups. Those national counts have a different denominator. Do not substitute them for a missing state entry or add a national group to its own detailed varieties.

Read the uncertainty alongside the rank

The number after ± is the 90% margin of error for the count. The chart orders point estimates, but nearby ranks may not be statistically different. Its bars are scaled to the largest displayed category within the selected state; they do not share a fixed pixel scale across states.

Source estimates are rounded independently, so an English-only count plus an other-language count may differ slightly from the published population total. The fifteen displayed categories also omit the state's less common reported categories. Neither difference is repaired by inventing an “other” count.

Save a chart and explore the national picture

The selected-state download is an SVG that keeps category counts, margins of error, population and source period together. The overview download shows the state percentages, while the CSV retains all published state counts and their uncertainty. Missing categories remain absent, not zero.

For a broader comparison, see the most common U.S. home-language categories. The French language profile illustrates how a language's national share can differ from its share in Maine, Vermont or Louisiana. The methodology explains the source boundaries and calculations used here.

Good questions

What is the most common language other than English in each state?

Choose a state to see its largest reported categories. In this 2017–2021 release, French leads the non-English point estimates in Maine and Vermont. The rankings describe home-language categories and may differ from rankings that combine broader language groups.

Why is my language missing from a state's list?

This source publishes only the top 15 non-English categories for each state. A missing language has no estimate in this table. It does not mean zero speakers, and we do not fill the gap using a national percentage.

Does another language at home mean someone cannot speak English?

No. People reporting another home language may also speak English. This page does not infer English ability, nationality, ancestry or fluency from a language choice.

Can I download a chart for my state?

Yes. Select a state and save its SVG chart, which includes all fifteen published categories, count margins of error and the source period. You can also download the alphabetical state overview or the complete CSV without an account.