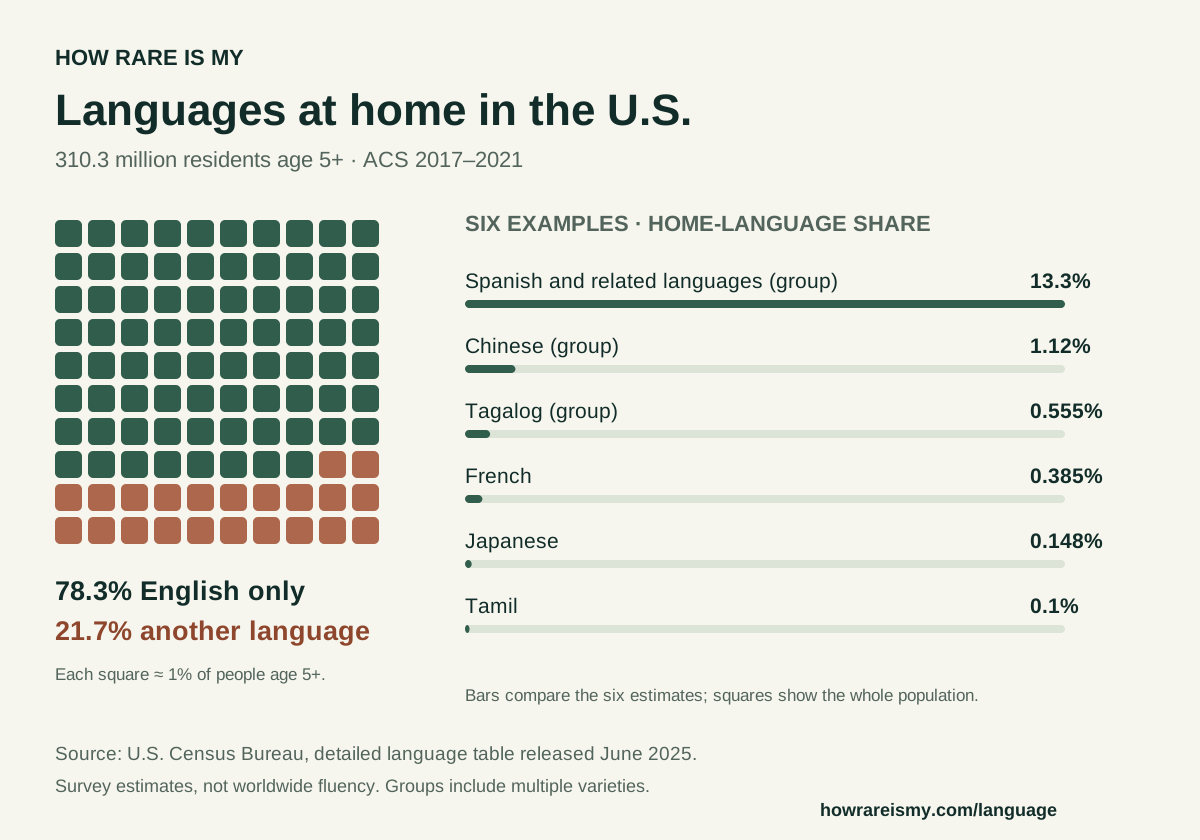
What does language rarity mean here?
This tool answers a specific version of “how rare is my language?”: how often a language was reported at home in the United States. Its comparison population is 310,300,000 residents age 5 and over, estimated from the 2017–2021 American Community Survey. The Census Bureau’s detailed language release, published in June 2025, supplies the counts and margins of error.
Search for a language, choose the matching category, and read its percentage, estimated number of people and uncertainty. The share is the published count divided by the population above. “About 1 in” reverses that fraction and rounds it for readability. For estimates whose margin of error is at least as large as the count, the result highlights uncertainty instead of a rarity percentage.
This five-year estimate describes a period. It is not five annual populations added together, and it is not a count of speakers today. We use this release because it includes much more language detail than the routine annual tables.
French, Mandarin and broader language groups
French illustrates why category labels matter. The detailed French row estimates 1,194,000 people, or about 0.385% of this U.S. population. The broader French group estimates 1,210,000 and also includes other French varieties. The two rows overlap; adding them would double-count people. The French language profile explains the breakdown and compares state examples.
Likewise, Mandarin Chinese and Yue Chinese have separate published rows within the broader Chinese group. A respondent recorded simply as Chinese belongs to another reported category. The detailed Mandarin estimate therefore cannot identify everyone who could speak Mandarin. The search accepts “Cantonese” to help you find the source’s Yue Chinese label.
Some entries describe language families or unspecified responses. They remain labeled as published categories or broader groups. The full downloadable CSV preserves the source labels, parent groups, estimates and 90% margins of error. Read the language methodology for the calculation and grouping rules.
The national language chart compares the largest detailed categories without adding their parent groups. For a different view, the language-by-state explorer shows fifteen reported categories per state and each state's own population denominator.
Compare languages and make a share card
Choose a second language to compare estimated home-language use in the same population and period. The bars compare the two counts; percentages use the complete age-5-and-over denominator. A group and one of its own varieties are marked as overlapping. Nearby estimates may not be statistically different, so there is no definitive “rarest language” leaderboard.
Open Preview & style your card to choose Sage, Lilac or Midnight. Save a 1080 × 1920 story image or a 1200 × 630 landscape card. The source period, U.S. population, category type and margin of error stay on the image. Your choice is processed on your device and is not placed in a URL or sent as an analytics event.
For another source-backed fact, check how rare your first name is within a published U.S. birth year, or explore your birthday’s rarity and calendar heatmap. Those tools use different records and populations; their results remain separate from your language estimate.
The adult height percentile calculator offers another comparison with a defined population: measured U.S. adults, grouped by age and sex. Its chart shows published percentile points and keeps the survey limits visible.
Good questions
How rare is French in the United States?
The detailed French category has an estimated 1,194,000 home speakers among 310,300,000 U.S. residents age 5 and over in the 2017–2021 ACS: about 0.385%, or 1 in 260. Its 90% margin of error is ±13,290 people. The broader French group, including other French varieties, has a separate estimate of 1,210,000.
Does this tell me how rare my language is worldwide?
No. This tool compares language reported at home among U.S. residents age 5 and over. It does not count all native speakers, learners or fluent speakers worldwide. A language can be uncommon in this U.S. population and common elsewhere.
Is this a how rare is my language filter?
You can make and download a story-sized language card here, with a Census estimate and its source. This is a website tool, not a TikTok or camera effect. Choose your language, open Preview & style your card, then save or share the image.
Can I find the rarity of speaking several languages?
You can compare two categories, but this table does not measure each person's complete language repertoire. We do not add or multiply the counts to invent the rarity of a language combination. Groups and their named varieties can overlap.
Why can’t I find my language?
Try a different spelling or look for a broader Census group. Some languages were not separately published or reported in this sample. Signed-language use is not separately measured here. Missing data does not mean there are no speakers or that a language is the rarest.