Use the income percentile calculator
Enter your annual household money income before tax, in whole U.S. dollars. Choose the householder's age group, or use All ages for the national household reference. Select Find my income percentile to see the band containing your amount.
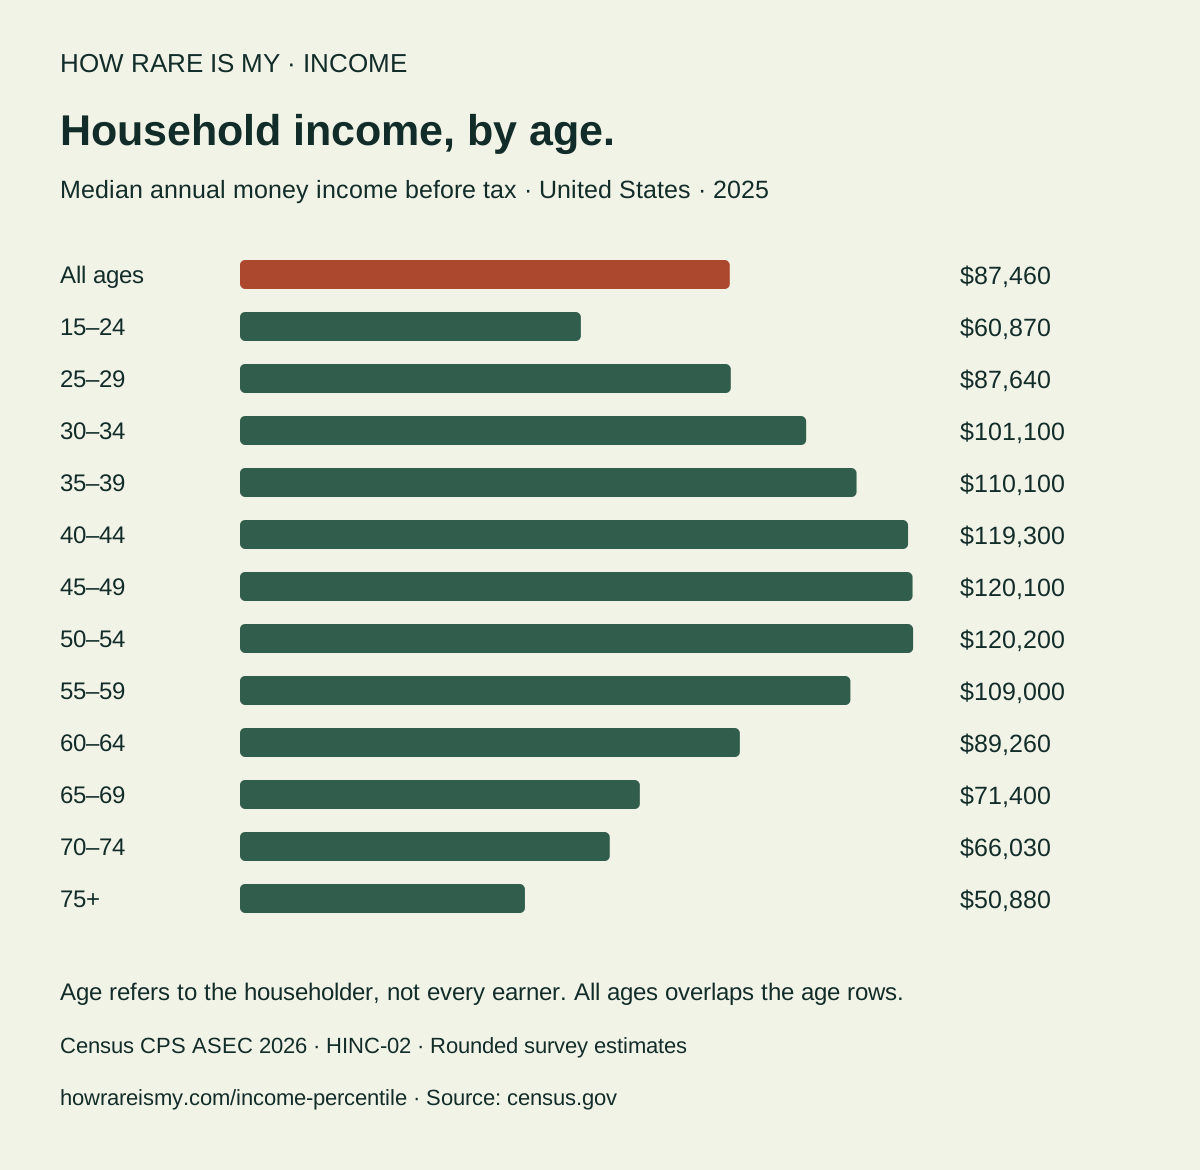
The distribution chart highlights that income band. The age comparison applies the same dollar amount to each published age group; selecting a group updates the result above. Those are different household populations in one survey, not a prediction of how your income will change as you age.
The income heatmap shows the whole distribution in wider bands. Darker cells contain a larger share of that age group's households. Rows use their own denominators, so compare the printed percentages rather than treating a cell as a count. The $150,000–$200,000 column spans a wider dollar interval, and the $200,000+ column is open-ended.
Income method
This tool uses the U.S. Census Bureau's HINC-02 household income table, Total households / All races, from the 2026 CPS Annual Social and Economic Supplement. It reports income received in 2025, with households as of March 2026. The all-age table represents an estimated 137.1 million households. This is a weighted population estimate, not the number interviewed.
The calculator retains the table's 41 income bands and twelve nonoverlapping age groups, from 15–24 to 75+. The all-age reference includes those groups. Published counts are rounded in thousands; we preserve their values and the published group totals. Parts can differ slightly from totals because of rounding.
For a given amount, the lower percentile is the sum of the income bands below its band, divided by the selected group's total. The upper percentile also includes its own band. We round the lower percentage down and the upper percentage up to whole numbers. We do not assume incomes are evenly distributed within a band. These are approximate bounds from a rounded survey table, not confidence limits or a count of households with your exact income.
The first band includes all incomes under $5,000, including zero and negative net money income. The last combines every income of $200,000 or more. Neither supports an exact rank in its tail. Median incomes are copied from the source's separate published median row; they are not estimated from our chart. The source totals and standard errors remain available beside the chart.
Which income and age should I use?
Census money income includes regular cash income before tax and payroll deductions. Household income combines the amounts received by members age 15 and over, including unrelated members. It can include wages, net self-employment income, interest and cash retirement or benefit income. Capital gains and noncash benefits are outside this measure. Use an annual total; a monthly paycheck alone is not comparable.
The CPS definitions define the householder through ownership or rental of the home. Age here is that person's age, not the average of all household members or necessarily the age of its highest earner.
This is a national household comparison, without adjustments for household size or cost of living. It is not an individual salary percentile, net-worth estimate, tax calculation or assessment of financial wellbeing. Current-dollar inputs are compared with 2025 amounts without an inflation conversion.
Keep the chart or your comparison
Download the median income chart or complete income-band CSV for all thirteen references. The CSV preserves each group's official denominator, median and median standard error. The heatmap's broader bands are sums of the corresponding source rows.
Preview & style your card keeps your chosen amount, age group, percentile band and source together. Inputs stay in page memory and disappear on refresh. Sharing a card intentionally includes its amount in the image; nothing is posted automatically.
For another example of how a reference population changes a percentile, explore adult height by age. The state-language explorer shows why geography also matters to a comparison. Each tool has its own source and method; we do not combine their results into personal rarity odds.
Good questions
Is this an individual salary or household income calculator?
It compares household money income, combining income received by household members age 15 and over, before tax. It does not rank one salary among individual workers. Use the age of the householder, a person in whose name the home is owned or rented.
Why is my income percentile a range?
The Census table groups incomes into bands. It cannot locate an exact amount within a band. We calculate cumulative shares below and through that band, rounding the displayed bounds outward to whole percentiles. The range reflects the grouped table, not a statistical confidence interval.
Which year's income does this compare?
The reference is money income received in 2025, reported in the 2026 Census Current Population Survey Annual Social and Economic Supplement. Households are described as of March 2026. Entering a current income compares its dollar amount with that historical reference; we do not automatically adjust for inflation.
Can this find my exact percentile above $200,000?
No. HINC-02 combines all household incomes of $200,000 or more in one open-ended band. The tool shows a lower percentile bound, not a precise rank or a top-one-percent claim.
Does the comparison adjust for household size or where I live?
No. These are national household estimates grouped by the householder's age. They do not adjust for household size, local costs, working hours, wealth or living standards. A percentile describes this income distribution, not how comfortably someone can live.