Use the adult height percentile calculator
Enter your height in centimeters or feet and inches, then choose an adult comparison group. Find my height percentile places you against measured U.S. heights. You can use all adults age 20 and over, or a published age band from 20–29 through 80+. The survey provides separate male and female reference categories; you choose which to compare with.
Measure standing height without shoes. The same measurement can fall at a different percentile in another group because the reference heights differ. The chart marks your result alongside the published percentile points, and the middle 50% range shows where half of the comparison group falls.
A height percentile answers how your measurement compares with other heights. It cannot tell you how many people share your exact height, whether a height is healthy, or how tall someone will become. Adults younger than 20 and children are outside this tool's reference population.
Height method
The source is Table 7 of the CDC / National Center for Health Statistics report, Anthropometric Reference Data for Children and Adults, published in June 2025. Its August 2021–August 2023 NHANES measurements represent the U.S. civilian noninstitutionalized population. The full adult comparison includes 2,690 male and 3,307 female participants with measured heights. Survey weights produce the population estimates; those sample counts are not population totals.
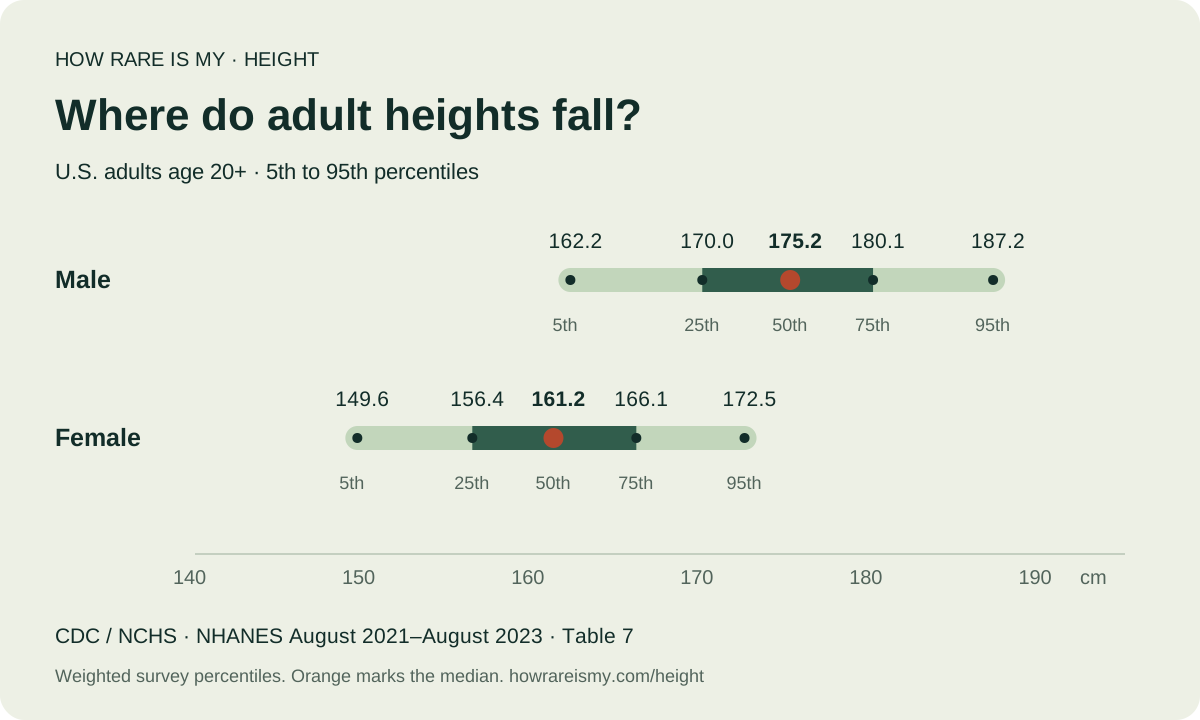
The table publishes the 5th, 10th, 15th, 25th, 50th, 75th, 85th, 90th and 95th percentiles, with some omissions. Between two published heights, this calculator estimates the percentile by linear interpolation. For example, in the male age-20+ reference, 175.2 cm is the 50th percentile and 180.1 cm is the 75th. Halfway between those measurements, 177.65 cm, gives an interpolated 62.5th percentile, displayed as about the 63rd.
These are survey estimates rounded to 0.1 cm in the source. The interpolation adds an approximation, so the result uses a whole-number percentile rather than a long decimal. The source's standard error of the mean is not a standard deviation and is never used to manufacture a bell curve.
For heights below the first published percentile or above the last, the result gives a bound. Both 80+ categories lack a published 95th percentile because its standard error could not be computed; their upper boundary is therefore the 90th. Missing values stay missing in the downloadable table. Read the site methodology for the source and reuse details.
Compare the chart and keep your result
The adult height chart shows the all-adult references on one centimeter scale. Its orange dots mark the medians, dark bars show the middle 50%, and pale bars extend from the 5th to the 95th percentile. Open the complete table for every published adult age band, or download the chart and CSV for reference.
Preview & style your card makes a story or landscape image with your height, comparison group, source period and estimation note. Changing the age band or reference category clears the old export until you calculate again. Your inputs stay in the page; they are not sent to a personal lookup service or put into a share URL. See privacy for delivery and analytics details.
For a different kind of comparison, explore the blood-type frequency chart, the eye-color survey, your birthday's rank and heatmap, your first name within a birth year, or U.S. home-language frequency. Each tool uses its own source and population. Their results are separate facts, so we never multiply them into a single probability of being you.
Good questions
What does my height percentile mean?
An estimated 75th percentile means about 75% of the selected comparison group are shorter and 25% are taller. The group here is U.S. adults in a published age and sex category. It is a comparison with a survey population, not a measure of health or personal worth.
Can I use this height calculator for a child or teenager?
This calculator covers adults age 20 and over. Children and teenagers need height-for-age growth references with their exact age. The adult table cannot predict a child's future height or assess growth.
Is this a worldwide height percentile?
No. The source represents the U.S. civilian noninstitutionalized population. It does not provide a global percentile or a comparison with a different country.
Why does my result say above the 95th percentile?
The adult table usually publishes percentiles from the 5th to the 95th. Outside that range, it supports a bound rather than an exact rank. For age 80 and over, the 95th percentile is omitted, so the upper limit is the published 90th percentile. We do not extrapolate an extreme percentage.
What is the average adult height in this data?
The survey estimates a mean height of 175.1 cm for male adults and 161.2 cm for female adults age 20 and over. The median, or middle height, is 175.2 cm and 161.2 cm respectively. These are U.S. NHANES estimates for August 2021–August 2023.